Showing posts with label MT4 INDICATORS. Show all posts

VOLTY CHANNEL STOP MT4 INDICATOR

0
VOLTY CHANNEL STOP MT4 INDICATOR


The Volty Channel Stop indicator uses the ATR and the Moving Average indicator for calculation of support/resistance lines. Bullet points are a signal that the trend is reversed.


It draws blue and red dots above /below the price , they signals reversal points in the trend.


How To Trade With Volty Channel Stop


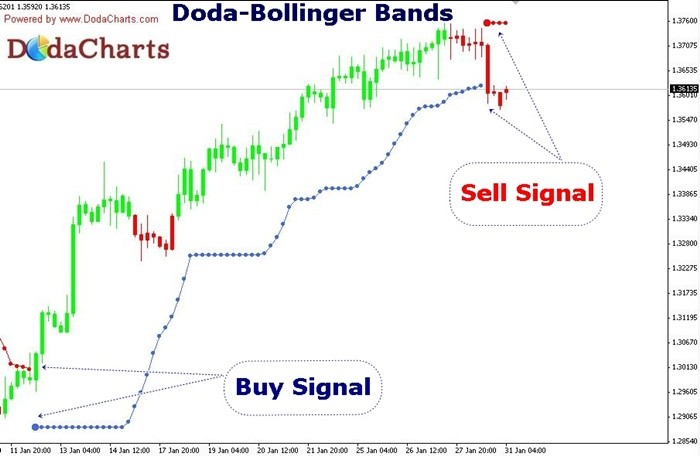
BUY : when a new blue dot appears below the price .Set stop loss few price below the blue dots


SELL : when a new  red dot appears above  the price .Set stop loss few price above  the red dots


Download


Doda-Bollinger Bands MT4 indicator

3

Doda-Bollinger Bands MT4 indicator


The Doda BB Bands indicator generates buy and sell signals based on the original Bollinger Bands indicator. Red dots mean bearish trend while blue dots mean bullish trend.


Trading Signals
BUY:  Buy when price closes above red line and you see blue line. .  In uptrends, Go long at the first blue dot and trail your stop-loss below the blue rising dots to lock in profits.
SELL:  Sell when price closes below blue line and you see red line. In Downtrend , Go short at the first red dot and trail your stop-loss above the red falling dots to lock in profits.
Works best on higher time frame like H4

Download


AUTO FIBONACCI RETRACEMENT MT4 INDICATOR

0


AUTO FIBONACCI RETRACEMENT MT4 INDICATOR


Just attach indicator to your chart and it will automatically place Fibonacci retracement lines from the highest and lowest visible bars on the chart.


Fibonacci Retracement Indicator for MT4 is used by many Technical traders, which will help you identify support and resistance levels,Take Profit and Stop Loss places.


This indicator will draw a fibonacci retracement from the low to high (or high to low depending on trend) on the visible candles on the chart.  
Lines are green when Fibonacci trend is up and red when down.
Download


BOLLINGER BAND STOP MT4 INDICATOR

0
BOLLINGER BAND STOP MT4 INDICATOR


Bollinger Bands Stop Indicator will show you where you 

should place your SL when entering the trade. Additional to 

that it will show you how to use it as a trailing stop. 


Download link

http://www.bestfxtradingsystems.com/bollinger-bands-stop-v-2-mt4-indicator/


Gann_HiLo_Activator mt4 indicator

0


Gann_HiLo_Activator mt4 indicator


The indicator consists of a single line which either flows above candles or below.

Depending on the position on the indicator line traders determine whether it is time to Sell or Buy. Indicator signals are confirmed only when price candles are closed.

When blue line is above the candle, SELL
When blue line is below the candle, BUY

unlike other indicators it'll give fewer false signals, it would be extremely difficult to profit with it during ranging markets.

Download indicator

http://www.mql5.com/en/code/8032


HEIKEN-ASHI MT4 INDICATOR

0

HEIKEN-ASHI MT4 INDICATOR
IMAGE


The Heiken-Ashi indicator looks like the candlestick chart, but it has some difference. Instead of the use of the standard OHLC values for candles, it uses another formulas:
Close = (Open+High+Low+Close)/4
Open = [Open (previous bar) + Close (previous bar)]/2
High = Max (High,Open,Close)
Low = Min (Low,Open, Close)

Heiken-ashi don't show open, high, low and close. Instead they calculate values of each candlestick based on the dominant forces in the market. E.g. if bears (sellers) are clearly dominating, Heiken-ashi candlesticks will be bearish (red), even if a price bar closes higher than it opened.

The advantage of the Heiken-Ashi charts is a simple trend determination, the upward trend candles are blue,the downward trend candles are red.


Sellers are dominating, strong downtrend
Heiken-ashi bearish candle

strong uptrend
Heiken-ashi bullish candle

The trend got a bit weaker

Heiken-ashi weakening trend

Download Heiken Ashi mt4 indicator